ATR-Reset Pivot Points ATR-Reset Pivot Points - Dynamic for London & NY Sessions
Standard daily pivots go stale fast after Asia — this version fixes that.
Key feature:
Instead of resetting on time (daily/4h/6h), pivots only update when price makes a REAL move.
How it works:
- Tracks 5m ATR(14) volatility (usually 200–400 pts on BTC)
- Resets pivots when price moves ≥ 1.7 × ATR (or min 300 pts) away from last reset high/low
- New P, R1–R5, S1–S5 are calculated from the exact candle where the big move happened
- Green triangle marks each reset
Why this matters for day trading:
- Asia: stays quiet, almost no resets → clean like standard pivots
- London open / NY killzone: auto-refreshes on real volume legs → levels always reflect current session structure
- No more sandwiching or fakeouts from 12-hour-old pivots
Best on BTCUSDT.P 5m
Recommended settings:
- ATR Multiplier: 1.7–2.0 (higher = fewer resets)
- Min Reset Points: 300–400 (safety net in chop)
- Pivot Type: Traditional or Fibonacci
Perfect for directional bias, Tokyo Protocol style, when real money flows in.
Prints fresh levels exactly when you need them most.
Enjoy the edge.
"pivot points" için komut dosyalarını ara

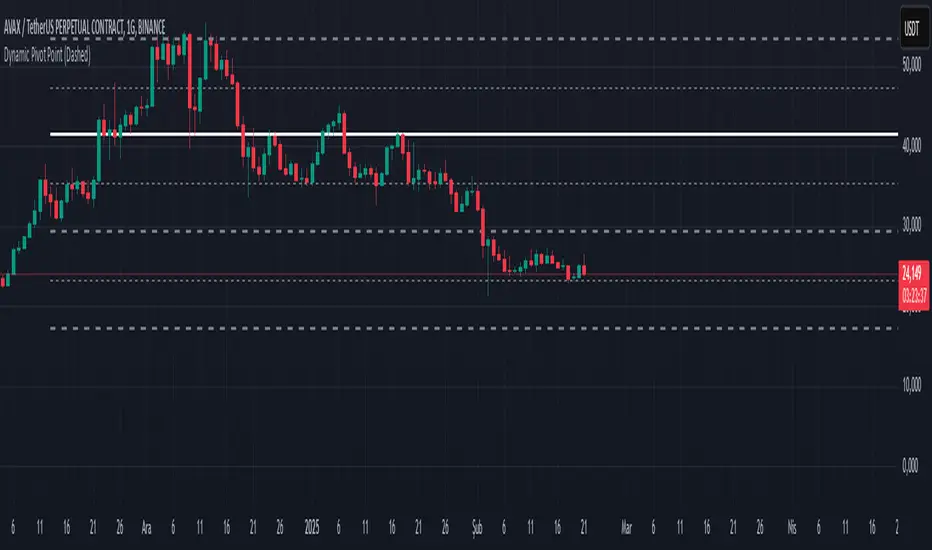
Dynamic Pivot PointsDynamic Pivot Point Indicator
The Dynamic Pivot Point is an indicator used on the TradingView platform that dynamically calculates pivot points and displays them on the chart. This indicator provides automatically adjustable support and resistance levels for different timeframes. By visualizing dynamic levels that match current market conditions, traders can plan their strategies more effectively.
Features
Adapts to Timeframes
The indicator automatically selects the appropriate pivot calculation method based on the user's current timeframe. For example:
For short timeframes such as 1, 3, or 5 minutes, it uses daily (1D) data.
For medium timeframes like 15, 30, or 60 minutes, it uses weekly (1W) data.
For longer timeframes such as 120, 180, or 240 minutes, it uses monthly (1M) data.
For very long timeframes like 360, 480 minutes, daily (D), or weekly (1W), it uses 12-month (12M) data.
Dynamic Pivot Levels
The indicator automatically calculates pivot levels based on the specified high and low values.
Flexible Line Style Options
Users can choose different line styles (Dashed, Dotted, Solid) to improve visual clarity on the chart.
Clean and Clear Visualization
The indicator automatically removes previous lines and displays the latest levels clearly on the chart, preventing clutter and allowing traders to focus more efficiently.
How It Works
Identifying High and Low Levels
The indicator retrieves previous and current high and low levels based on the selected timeframe.
New high and low levels are updated by comparing them with previous levels.
Calculating Pivot Levels
Pivot points are calculated using Fibonacci ratios between high and low levels.
These levels represent dynamic support and resistance zones.
Drawing Lines
The calculated levels are displayed as lines on the chart, each represented with different colors and styles.
Use Cases
Support and Resistance Levels
The indicator dynamically calculates and displays support and resistance levels, serving as reference points for buy and sell decisions.
Trend Analysis
Fibonacci levels help identify trend strength and potential reversal points.
Risk Management
Pivot points assist in setting stop-loss and take-profit levels.
Multi-Timeframe Analysis
Since the indicator adapts to different timeframes, it can be used for both short-term and long-term analysis.
Advantages
✅ Automatic Calculation: No manual calculations are required, as it updates dynamically.
✅ Flexible Timeframe Support: Adapts to different timeframes.
✅ Visual Clarity: Line styles and colors make it easy to distinguish levels on the chart.
✅ Fibonacci Integration: Adds depth to technical analysis.
Conclusion
The Dynamic Pivot Point indicator is a useful tool for both beginners and experienced traders. By dynamically calculating pivot points and Fibonacci levels, it simplifies market analysis and aids in strategy development. With its flexible structure and clear visualization, it can be effectively used across all timeframes.
6 dakika önce
Sürüm Notları
This indicator is written for Support Resistance Traders
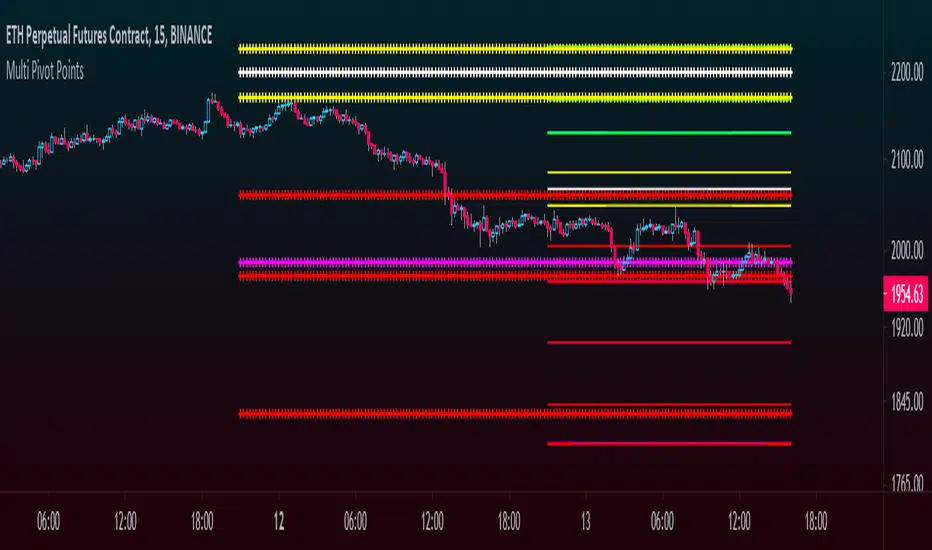
Multi Pivot Points - All in One IndicatorThis multi pivot indicator allows you to plot and overlay different types of pivot points:
-Fibonacci
-Floor Traders
-Camarilla
In addition to this, you can plot pivots from two different timeframes of your choice, for example the daily & weekly pivots, monthly & yearly, etc.
-You can select the linestyle, width and color of each pivot type for easy recognition of levels.
-You can choose to show only the current set of pivots or you can show the historical levels too.
This indicator allows traders to search for high probability targets or support and resistance zones via the confluence of both different pivot types and timeframes. These levels can work for either day traders or longer terms traders.
In the case of Fibonacci levels these can be chosen in the menu.
Enjoy!!
BuyHighSellLow - Pivot pointsAnother version of buy-high sell-low strategy. This time using pivot points.
Strategy is simple:
Buy when price closes above R1 of pivot point level
Sell when price closes below S2 of pivot point level.
Use Resolution parameter to define pivot points. Higher the resolution, longer the trade time will be. If resolution is set to same as symbol, strategy will consider Higher Timeframe Multiplier to derive pivot point resolution.
Uncheck HideBands to see bands created from pivot points.
Another Buy-High Sell-Low strategy published is using donchian channel (Link below)

Predictive Pivot Points based on Technicals Did this indicator as an experiment for fun and it actually works pretty well!
What it does?
Well, Pivot Points (PP) are useful but delayed. So the premise of this indicator is pretty simple. It stores variables from previous Pivot Highs and Pivot Lows (RSI, MFI, Stochastics and volume) and then looks for like circumstances to trigger early pivot alerts based on historic pivot traits.
And that's pretty much it.
It also acts as a normal pivot indicator, but it will display the data that is being logged. You can see in the chart above but here is another image:
How to use it?
So, there are a lot of inputs. First off, you can customize the data you want stored, in terms of the RSI, MFI and Stochastic source and length.
You can then set the thresholds for triggering. The default threshold is +/- 2. That means, it will look for similarities within +/- 2 of the previous pivot points.
You can then select to see each individual technical to signal pivots. That means, it will look at RSI, MFI, Stochastic and Volume in isolation to trigger early pivot signals. See the image below:
In the image above, you can see it signaling pivots based on individual technical readouts from RSI, to Stochastics and MFI and Volume.
If you want it to be a bit more strict, you can have it only trigger when all 3 (MFI, Stochastics and RSI) are similar. Note that volume has been excluded in the identical instances:
In the image above, you will see it triggers based on all 3 being similar. Note that when you select this option, you will get a lot less signals but more rigorous signals.
Final thoughts:
That is basically the indicator in a nut shell. Its pretty self explanatory.
If you have any specific questions feel free to leave them below.
Thanks for checking this out and safe trades!

ASFX EMAs, ADR, Asian Range, and Pivot PointsThis indicator combines the essential indicators that ASFX traders use, including the EMAs (8, 21, 50, 200, 800), the Average Daily Range, the Asian Range, and the Pivot Points.
The EMAs should be used as dynamic supports and resistances. We could use it to find entries like when there is a bullish engulfing coming off the 21 EMA.
The Average Daily Range tells us the how many pips the pair moves on average. We could use it to measure risk/reward ratios or see it as another resistance.
The Asian Range is displayed as two lines indicating the Asian Session's High and Low. This could help us to determine whether the pair is ready for a breakout. We might avoid setups that are still in the Asian Range as the pair might still be indecisive.
The Pivot Points are also another form of support and resistance which are calculated using the previous day's data. The Pivot Points displayed in this indicator only include the Pivot, R1, R2, R3, S1, S2, S3. (R4, R5, S4, S5 are not included)
All of these indicators should give us a read of the trend. If the EMAs are beautifully fanned out with the 8 EMA on the top and the 800 EMA on the bottom and the price is above the Asian Range and the Pivot, we might keep an eye for a long entry.

Camarilla Pivot Points V2 Backtest Camarilla pivot point formula is the refined form of existing classic pivot point formula.
The Camarilla method was developed by Nick Stott who was a very successful bond trader.
What makes it better is the use of Fibonacci numbers in calculation of levels.
Camarilla equations are used to calculate intraday support and resistance levels using
the previous days volatility spread. Camarilla equations take previous day’s high, low and
close as input and generates 8 levels of intraday support and resistance based on pivot points.
There are 4 levels above pivot point and 4 levels below pivot points. The most important levels
are L3 L4 and H3 H4. H3 and L3 are the levels to go against the trend with stop loss around H4 or L4 .
While L4 and H4 are considered as breakout levels when these levels are breached its time to
trade with the trend.
WARNING:
- For purpose educate only
- This script to change bars colors.

Camarilla Pivot Points V2 Strategy Camarilla pivot point formula is the refined form of existing classic pivot point formula.
The Camarilla method was developed by Nick Stott who was a very successful bond trader.
What makes it better is the use of Fibonacci numbers in calculation of levels.
Camarilla equations are used to calculate intraday support and resistance levels using
the previous days volatility spread. Camarilla equations take previous day’s high, low and
close as input and generates 8 levels of intraday support and resistance based on pivot points.
There are 4 levels above pivot point and 4 levels below pivot points. The most important levels
are L3 L4 and H3 H4. H3 and L3 are the levels to go against the trend with stop loss around H4 or L4 .
While L4 and H4 are considered as breakout levels when these levels are breached its time to
trade with the trend.
WARNING:
- For purpose educate only
- This script to change bars colors.
Camarilla Pivot Points V2 Camarilla pivot point formula is the refined form of existing classic pivot point formula.
The Camarilla method was developed by Nick Stott who was a very successful bond trader.
What makes it better is the use of Fibonacci numbers in calculation of levels.
Camarilla equations are used to calculate intraday support and resistance levels using
the previous days volatility spread. Camarilla equations take previous day’s high, low and
close as input and generates 8 levels of intraday support and resistance based on pivot points.
There are 4 levels above pivot point and 4 levels below pivot points. The most important levels
are L3 L4 and H3 H4. H3 and L3 are the levels to go against the trend with stop loss around H4 or L4 .
While L4 and H4 are considered as breakout levels when these levels are breached its time to
trade with the trend.
WARNING:
- For purpose educate only

Montly Pivot Points indicatorA pivot point indicator that has possibility to see even the monthly or the weekly pivot points.
Pivot points are very powerful if used in correct way.
most of the time the price can be rejected from the pivot point or if the price break it it will be a nice entry if retest the pivot
R2/S2 are a very strong pivots to break but of course you need a certain distance between the pivot.

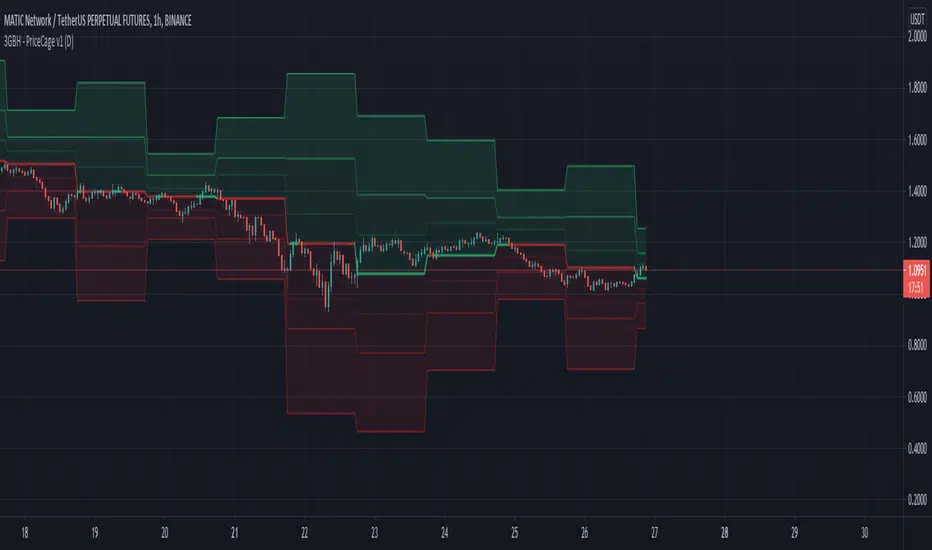
3GBH - Pivot Points & Fib LevelsThis indicator displays Pivot Points & Fib Levels based on the timeframe you select.
-----
There are 3-levels of support/resistance to the Pivot Points.
-----
Currently there are only Fib-Levels based on the 1st Pivot Levels .
Fibs will be added to the other 2 levels in the near future.
The Golden Ratio is highlighted by default.
-----
The Pivot Line is either green or red depending on whether the price is above or below.
-----
Fibonacci tools are quickly becoming a favorite of mine. This helps me to practice working with them,
and may help to be more efficient in doing analysis.
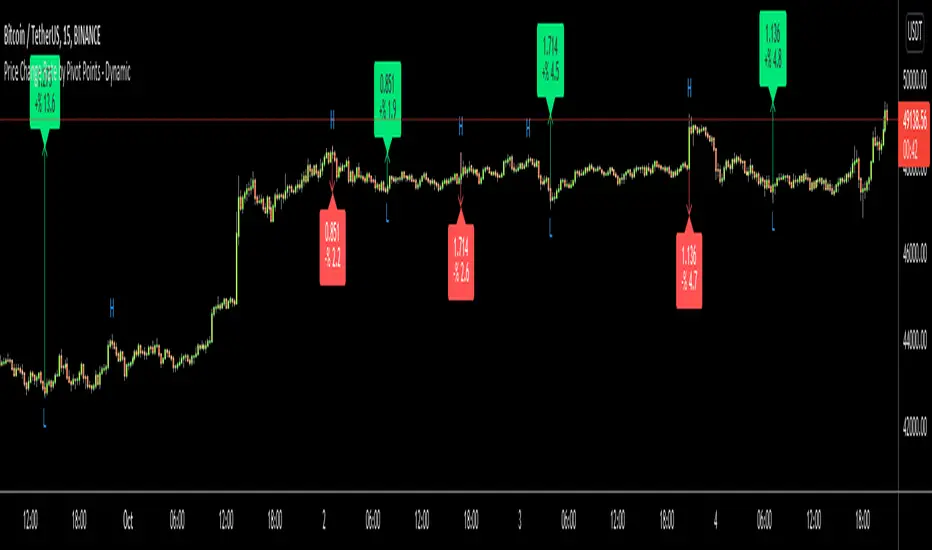
Price Change Rate by Pivot Points - DynamicHi Everyone
Usually I need Price Change info and I believe most of you need this info too. I want to see how it increased/decreased. I automate this by using Pivot Points.
it works dynamically and it uses Pivot Highs and Pivot Lows accordingly. That means it calculates which one to use.
Please watch following video:
Enjoy!
Fibonacci Pivot PointsI have included the main support and resistance pivot point levels for the Fibonacci Pivot Points. I changed the bar colors to reflect buy and sell points so if a bar is green then that means to buy it and if it is red then sell it
Let me know if you would like to see me do any other indicators!

Dynamic Fibonacci Pivot Points & EMA CrossoversI have created this script for those who face difficulties drawing Fibonacci levels as this script is Dynamic so it automatically calculates the ranges based on current High and Lows. I have also added Standard Fibonacci Pivot Points so that we can easily see the confluences between Dynamic and Standard pivot points. Apart from this I have also added EMA Crossovers so that we can easily identify trend changes. You can modify this script as per your own.

SHA Multi Pivot Points -v1.0.0🔎Using Pivot Points in Trading
Traders use PPs to help determine predefined support and resistance levels to guide their trading strategies. In addition, traders identify potential price reversals, trend direction, and breakout opportunities:
Trend identification: PPs act as a reference level to gauge market sentiment. If the price opens above the PP and remains above it, traders interpret this as an uptrend. Conversely, if the price opens below the pivot point and stays below, it suggests a downtrend.
Support and resistance determination: Pivot levels are natural barriers where price reactions frequently occur. Traders may enter long positions near support levels, expecting a price bounce, or if the price approaches resistance levels, traders may consider shorting the asset.
Breakout trading: When the price breaks above resistance or support, it may indicate strong momentum for further movement.
Reversal identification: Traders also look for failed breakouts or price rejections at pivot levels to anticipate reversals.
Trading strategy combinations: Traders can improve accuracy by combining PPs with other technical analysis indicators.
1. Camarilla Pivot Points
📌 Overview:
Developed by Nick Scott in 1989, Camarilla Pivot Points are designed for short-term, intraday trading. Unlike traditional pivots, Camarilla levels are tighter and more responsive, making them useful in volatile markets.
📐 Key Levels:
It generates eight levels:
- Resistance: Initial Level (R1), Mid-range Level (R2), Sell Reversal Level (R3), Breakout Level (R4)
- Support: Initial Level (S1), Mid-range Level (S2), Buy Reversal Level (S3), Breakout Level (S4)
✅ How to Use:
- S1/R1 + RSI or volume divergence to confirm weak momentum and early reversals.
- S2/R2 with price action patterns to enter early on major moves before L3/H3 get tested.
- S3/R3: Mean-reversion zones → price often reverses.
- Break of S4/R4: Strong breakout → trend-following signal.
- Combine with volume or candlestick confirmation for entries.
🔹 2. Floor (Standard) Pivot Points
📌 Overview:
This is the most traditional pivot method, widely used by floor traders. It’s symmetrical and provides a clear central pivot point with equally spaced support and resistance levels.
📐 Key Levels:
- Povit Points : Average price (PPs)
- Resistance : First price ceiling (R1), Stronger ceiling (R2), Extreme resistance (R3)
- Support : First price floor (S1), Stronger floor (S2), Extreme support (S3)
✅ How to Use:
- Above PPs = bullish bias; Below PPs = bearish bias.
- S1/R1 are most used for intraday targets.
- S2–S3/R2–R3 indicate potential extreme moves.
- Often used in combination with momentum indicators.
🔹 3. Woodie Pivot Points
📌 Overview:
Woodie’s pivot formula gives double weight to the closing price, emphasizing the most recent session's sentiment.
📐 Key Levels:
- Povit Points : Weighted average (PPs)
- Resistance : First price ceiling (R1), Stronger resistance (R2)
- Support : First price floor (S1), Stronger support (S2)
✅ How to Use:
- Works best in fast-moving markets.
- PPs acts as a momentum-based balance level.
- Good for scalpers and momentum traders.
🔹 4. Fusion Pivot Points
📌 Overview:
This method differs significantly — it calculates only one support and one resistance level, adjusting based on the relationship between the open and close.
📐 Key Levels:
- Povit Points : Single directional (PPs)
- Resistance : Potential ceiling (R)
- Support : Potential floor (S)
✅ How to Use:
- Not symmetrical → more responsive to price behavior.
- Best for breakout or reversal strategies.
- Use when you're expecting directional momentum.
🔹 5. Classic Pivot Points (Traditional)
📌 Overview:
Also known as Standard or Traditional Pivot Points, this is the default method used by most charting platforms. It offers a balanced and simple framework.
📐 Key Levels:
- Povit Points : Central price level (PPs)
- Resistance : First ceiling (R1), Stronger resistance (R2), Extreme resistance (R3)
- Support : First floor (S1), Stronger floor (S2), Extreme support (S3)
✅ How to Use:
- PPs is the market’s equilibrium point.
- Helps define market structure, bias, and trade zones.
- Combine with order blocks, RSI, or MACD for confirmation.
📊 Summary Comparison :
1. Camarilla Pivot Points
- Focus : Mean Reversion & Breakouts
- Best Use : Scalping, Day Trading
2. Floor Pivot Points
- Focus : General Support/Resistance
- Best Use : Intraday, Swing
3. Woodie Pivot Points
- Focus : Recent Close Emphasis
- Best Use : Momentum Trading
4. Fusion Pivot Points
- Focus : Trend/Breakout
- Best Use : Directional Breakouts
5. Classic Povit Points
- Focus : Market Structure
- Best Use : General Use
⚠️ Disclaimer
The information and tools provided in this script are for educational and informational purposes only. They do not constitute financial advice, investment recommendations, or a solicitation to buy or sell any financial instrument.
Trading in the financial markets involves risk of loss and is not suitable for every investor. You are solely responsible for your trading decisions. Always do your own research, use proper risk management, and consult a licensed financial advisor before making any financial decisions.

Long-Only Opening Range Breakout (ORB) with Pivot PointsIntraday Trading Strategy: Long-Only Opening Range Breakout (ORB) with Pivot Points
Background:
Opening Range Breakout (ORB) is a popular long-only trading strategy that capitalizes on the early morning volatility in financial markets. It's based on the idea that the initial price movements during the first few minutes or hours of the trading day can set the tone for the rest of the session. The strategy involves identifying a price range within which the asset trades during the opening period and then taking long positions when the price breaks out to the upside of this range.
Pivot Points are a widely used technical indicator in trading. They represent potential support and resistance levels based on the previous day's price action. Pivot points are calculated using the previous day's high, low, and close prices and can help traders identify key price levels for making trading decisions.
How to Use the Script:
Initialization: This script is written in Pine Script, a domain-specific language for trading strategies on the TradingView platform. To use this script, you need to have access to TradingView.
Apply the Script: You can do this by adding it to your favorites, then selecting the script in the indicators list under favorites or by searching for it by name under community scripts.
Customize Settings: The script allows you to customize various settings through the TradingView interface. These settings include:
Opening Session: You can set the time frame for the opening session.
Max Trades per Day: Specify the maximum number of long trades allowed per trading day.
Initial Stop Loss Type: Choose between using a percentage-based stop loss or the previous candles low for stop loss calculations.
Stop Loss Percentage: If you select the percentage-based stop loss, specify the percentage of the entry price for the stop loss.
Backtesting Start and End Time: Set the time frame for backtesting the strategy.
Strategy Signals:
The script will display pivot points in blue (R1, R2, R3, R4, R5) and half-pivot points in gray (R0.5, R1.5, R2.5, R3.5, R4.5) on your chart.
The green line represents the opening range.
The script generates long (buy) signals based on specific conditions:
---The open price is below the opening range high (h).
---The current high price is above the opening range high.
---Pivot point R1 is above the opening range high.
---It's a long-only strategy designed to capture upside breakouts.
---It also respects the maximum number of long trades per day.
The script manages long positions, calculates stop losses, and adjusts long positions according to the defined rules.
Trailing Stop Mechanism
The script incorporates a dynamic trailing stop mechanism designed to protect and maximize profits for long positions. Here's how it works:
1. Initialization:
The script allows you to choose between two types of initial stop loss:
---Percentage-based: This option sets the initial stop loss as a percentage of the entry price.
---Previous day's low: This option sets the initial stop loss at the previous day's low.
2. Setting the Initial Stop Loss (`sl_long0`):
The initial stop loss (`sl_long0`) is calculated based on the chosen method:
---If "Percentage" is selected, it calculates the stop loss as a percentage of the entry price.
---If "Previous Low" is selected, it sets the stop loss at the previous day's low.
3. Dynamic Trailing Stop (`trail_long`):
The script then monitors price movements and uses a dynamic trailing stop mechanism (`trail_long`) to adjust the stop loss level for long positions.
If the current high price rises above certain pivot point levels, the trailing stop is adjusted upwards to lock in profits.
The trailing stop levels are calculated based on pivot points (`r1`, `r2`, `r3`, etc.) and half-pivot points (`r0.5`, `r1.5`, `r2.5`, etc.).
The script checks if the high price surpasses these levels and, if so, updates the trailing stop accordingly.
This dynamic trailing stop allows traders to secure profits while giving the position room to potentially capture additional gains.
4. Final Stop Loss (`sl_long`):
The script calculates the final stop loss level (`sl_long`) based on the following logic:
---If no position is open (`pos == 0`), the stop loss is set to zero, indicating there is no active stop loss.
---If a position is open (`pos == 1`), the script calculates the maximum of the initial stop loss (`sl_long0`) and the dynamic trailing stop (`trail_long`).
---This ensures that the stop loss is always set to the more conservative of the two values to protect profits.
5. Plotting the Stop Loss:
The script plots the stop loss level on the chart using the `plot` function.
It will only display the stop loss level if there is an open position (`pos == 1`) and it's not a new trading day (`not newday`).
The stop loss level is shown in red on the chart.
By combining an initial stop loss with a dynamic trailing stop based on pivot points and half-pivot points, the script aims to provide a comprehensive risk management mechanism for long positions. This allows traders to lock in profits as the price moves in their favor while maintaining a safeguard against adverse price movements.
End of Day (EOD) Exit:
The script includes an "End of Day" (EOD) exit mechanism to automatically close any open positions at the end of the trading day. This feature is designed to manage and control positions when the trading day comes to a close. Here's how it works:
1. Initialization:
At the beginning of each trading day, the script identifies a new trading day using the `is_newbar('D')` condition.
When a new trading day begins, the `newday` variable becomes `true`, indicating the start of a new trading session.
2. Plotting the "End of Day" Signal:
The script includes a plot on the chart to visually represent the "End of Day" signal. This is done using the `plot` function.
The plot is labeled "DayEnd" and is displayed as a comment on the chart. It signifies the EOD point.
3. EOD Exit Condition:
When the script detects that a new trading day has started (`newday == true`), it triggers the EOD exit condition.
At this point, the script proceeds to close all open positions that may have been active during the trading day.
4. Closing Open Positions:
The `strategy.close_all` function is used to close all open positions when the EOD exit condition is met.
This function ensures that any remaining long positions are exited, regardless of their current profit or loss.
The function also includes an `alert_message`, which can be customized to send an alert or notification when positions are closed at EOD.
Purpose of EOD Exit
The "End of Day" exit mechanism serves several essential purposes in the trading strategy:
Risk Management: It helps manage risk by ensuring that positions are not left open overnight when markets can experience increased volatility.
Capital Preservation: Closing positions at EOD can help preserve trading capital by avoiding potential adverse overnight price movements.
Rule-Based Exit: The EOD exit is rule-based and automatic, ensuring that it is consistently applied without emotions or manual intervention.
Scalability: It allows the strategy to be applied to various markets and timeframes where EOD exits may be appropriate.
By incorporating an EOD exit mechanism, the script provides a comprehensive approach to managing positions, taking profits, and minimizing risk as each trading day concludes. This can be especially important in volatile markets like cryptocurrencies, where overnight price swings can be significant.
Backtesting: The script includes a backtesting feature that allows you to test the strategy's performance over historical data. Set the start and end times for backtesting to see how the long-only strategy would have performed in the past.
Trade Execution: If you choose to use this script for live trading, make sure you understand the risks involved. It's essential to set up proper risk management, including position sizing and stop loss orders.
Monitoring: Monitor the long-only strategy's performance over time and be prepared to make adjustments as market conditions change.
Disclaimer: Trading carries a risk of capital loss. This script is provided for educational purposes and as a starting point for your own long-only strategy development. Always do your own research and consider seeking advice from a qualified financial professional before making trading decisions.

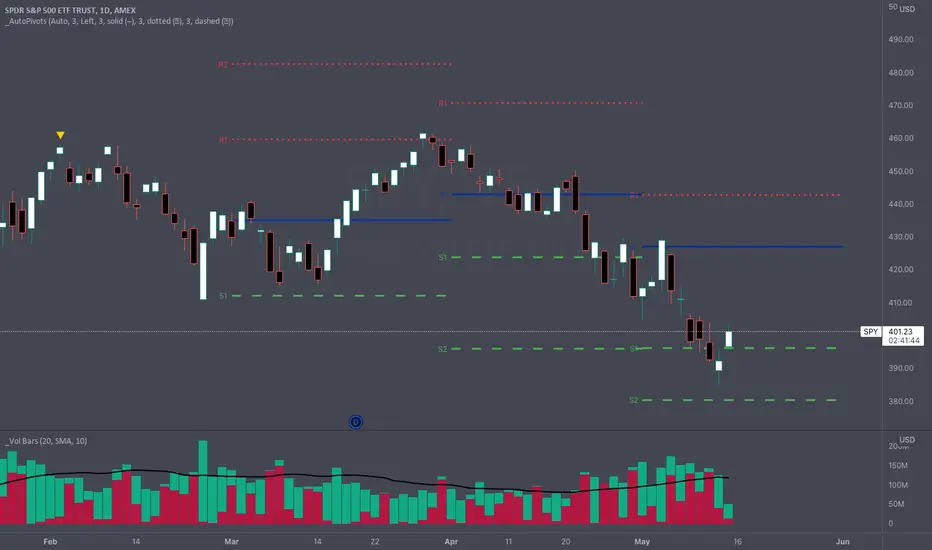
_Auto Pivot PointsOne of the main drawbacks to displaying Pivot Points on a chart is that many times the more extreme pivots (R/S3, R/S4, R/S5) aren't anywhere close to the price action during a timeframe. These extreme pivot points clutter up your chart and make it hard to use the "auto" zoom feature of TradingView.
The " _Auto Pivot Points " indicator solves these problems by automatically only displaying the pivot points if the price has crossed the pivot during the timeframe or it is the next closest pivot . For example, on monthly pivots if the price has only crossed the R1 Pivot then this indicator will display the R2 Pivot and any pivots below but it won't display the R3, R4, R5 pivots . The R3, R4, & R5 pivots are not very useful to the trader because the price hasn't even crossed the R2 Pivot . But as soon as the price crosses the R2 Pivot then this indicator will display the R3 Pivot because it is the next closest. And the same logic applies to the S Pivots .
If you need to see all the Pivots then there is a convenient toggle to display all the pivots by turning off the intelligent auto pivots . But as soon as you don't need to display all the pivots the toggle will turn on the automatic pivots .
This indicator has many style and logic options. This script allows you to control:
Number of past timeframes to display
Displaying Pivot labels
Label position (left/right)
Line color
Line width
Note: TradingView has a limit of 40 security calls per script. Due to this limitation this indicator can only display pivots a max of 7 time periods back.
Note 2: This indicator uses the Traditional pivot calculations.
AG FX - Pivot PointsPivot Points High Low
Definition
The Pivot Points High Low indicator is used to determine and anticipate potential changes in market price and reversals. The Highs referred to in the title are created based on the number of bars that exhibit lower highs on either side of a Pivot Point High, whereas the Lows are created based on the number of bars that exhibit higher lows on either side of a Pivot Point Low.
Calculations
As mentioned above, Pivot Point Highs are calculated by the number of bars with lower highs on either side of a Pivot Point High calculation. Similarly, Pivot Point Lows are calculated by the number of bars with higher lows on either side of a Pivot Point Low calculation.
Takeaways and what to look for
A Pivot Point is more significant or noteworthy if the trend is extended or longer than average. This can mean if a trader selects a higher period for before and after the Pivot Point, the trend could be longer and therefore prove the Pivot Point itself more notable.
Additionally, Pivot Points can help a trader assess where would be best to draw. By analyzing price changes and reversals, a trader has more of an ability to determine and predict price patterns and general price trends.
Summary
The Pivot Points High Low indicator can predict and determine price changes and potential reversals in the market. Pivot Points can also help traders identify price patterns and trends, depending on the period and significance of the Pivot Point value.

Fibonacci Extension / Retracement / Pivot Points by DGTFɪʙᴏɴᴀᴄᴄɪ Exᴛᴇɴᴛɪᴏɴ / Rᴇᴛʀᴀᴄᴍᴇɴᴛ / Pɪᴠᴏᴛ Pᴏɪɴᴛꜱ
This study combines various Fibonacci concepts into one, and some basic volume and volatility indications
█ Pɪᴠᴏᴛ Pᴏɪɴᴛꜱ — is a technical indicator that is used to determine the levels at which price may face support or resistance. The Pivot Points indicator consists of a pivot point (PP) level and several support (S) and resistance (R) levels. PP, resistance and support values are calculated in different ways, depending on the type of the indicator, this study implements Fibonacci Pivot Points
The indicator resolution is set by the input of the Pivot Points TF (Timeframe). If the Pivot Points TF is set to AUTO (the default value), then the increased resolution is determined by the following algorithm:
for intraday resolutions up to and including 5 min, 4HOURS (4H) is used
for intraday resolutions more than 5 min and up to and including 45 min, DAY (1D) is used
for intraday resolutions more than 45 min and up to and including 4 hour, WEEK (1W) is used
for daily resolutions MONTH is used (1M)
for weekly resolutions, 3-MONTH (3M) is used
for monthly resolutions, 12-MONTH (12M) is used
If the Pivot Points TF is set to User Defined, users may choose any higher timeframe of their preference
█ Fɪʙ Rᴇᴛʀᴀᴄᴇᴍᴇɴᴛ — Fibonacci retracements is a popular instrument used by technical analysts to determine support and resistance areas. In technical analysis, this tool is created by taking two extreme points (usually a peak and a trough) on the chart and dividing the vertical distance by the key Fibonacci coefficients equal to 23.6%, 38.2%, 50%, 61.8%, and 100%. This study implements an automated method of identifying the pivot lows/highs and automatically draws horizontal lines that are used to determine possible support and resistance levels
█ Fɪʙᴏɴᴀᴄᴄɪ Exᴛᴇɴꜱɪᴏɴꜱ — Fibonacci extensions are a tool that traders can use to establish profit targets or estimate how far a price may travel AFTER a retracement/pullback is finished. Extension levels are also possible areas where the price may reverse. This study implements an automated method of identifying the pivot lows/highs and automatically draws horizontal lines that are used to determine possible support and resistance levels.
IMPORTANT NOTE: Fibonacci extensions option may require to do further adjustment of the study parameters for proper usage. Extensions are aimed to be used when a trend is present and they aim to measure how far a price may travel AFTER a retracement/pullback. I will strongly suggest users of this study to check the education post for further details, where to use extensions and where to use retracements
Important input options for both Fibonacci Extensions and Retracements
Deviation, is a multiplier that affects how much the price should deviate from the previous pivot in order for the bar to become a new pivot. Increasing its value is one way to get higher timeframe Fib Retracement Levels
Depth, affects the minimum number of bars that will be taken into account when building
█ Volume / Volatility Add-Ons
High Volatile Bar Indication
Volume Spike Bar Indication
Volume Weighted Colored Bars
This study benefits from build-in auto fib retracement tv study and modifications applied to get extentions and also to fit this combo
Disclaimer:
Trading success is all about following your trading strategy and the indicators should fit within your trading strategy, and not to be traded upon solely
The script is for informational and educational purposes only. Use of the script does not constitute professional and/or financial advice. You alone have the sole responsibility of evaluating the script output and risks associated with the use of the script. In exchange for using the script, you agree not to hold dgtrd TradingView user liable for any possible claim for damages arising from any decision you make based on use of the script

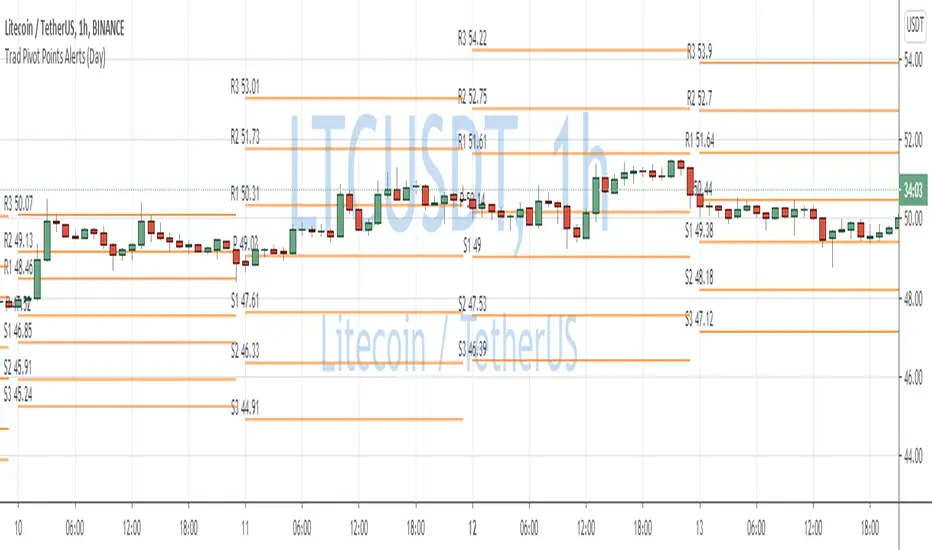
Traditional Pivot Points AlertsCreated a script for alerts on Traditional Pivot Points.
You will be able to create separate alerts for every level or create one for price crossing any level.
Because of some TradingView limitations, alerts won't be fired for the first bar of the session. Will try to solve that in the new versions.
In the script used new v4 plotting features, so will be able to plot levels and labels nicely. Unfortunately, there is a limit on the number of consecutive lines you can plot on the plot (around 50), so lines in the past will disappear.
You can enable/disable in params displaying level itself on the chart.
And remember:
Past performance does not guarantee future results.
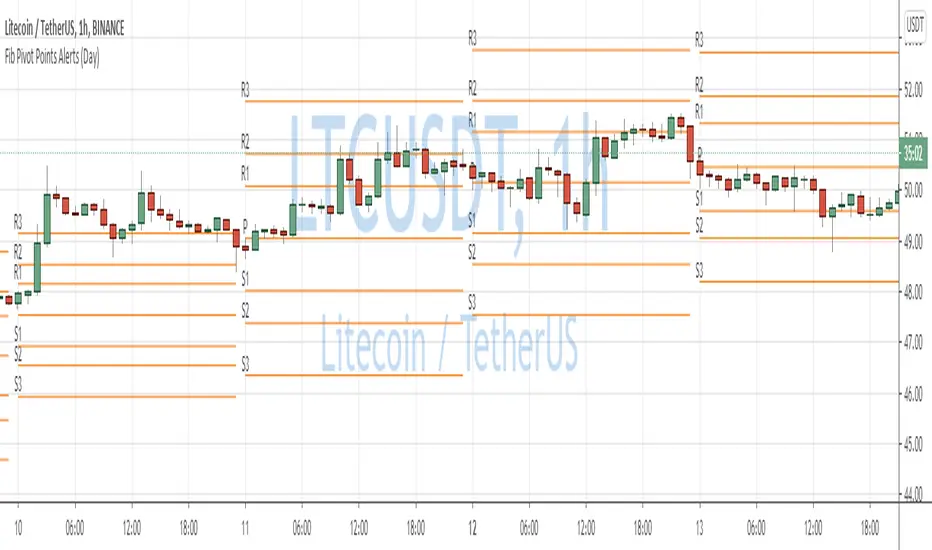
Fibonacci Pivot Points AlertsCreated a script for alerts on Fibonacci Pivot Points.
You will be able to create separate alerts for every level or create one for price crossing any level.
Because of some TradingView limitations, alerts won't be fired for the first bar of the session. Will try to solve that in the new versions.
In the script used new v4 plotting features, so will be able to plot levels and labels nicely. Unfortunately, there is a limit on the number of consecutive lines you can plot on the plot (around 50), so lines in the past will disappear.
And remember:
Past performance does not guarantee future results.
TKP Weekly, Monthly and Yearly Fib Pivot PointsThis script allows you to plot Weekly, Monthly and Yearly Fibonacci Pivot Points. I used templates from others I found on TradingView, special thanks given in the Script. I prefer Longer time frames, especially yearly Pivots, to predict reversals and places to trim risk, so this was tailored to my needs. Hope this helps!
SVE Pivot PointsSVE Pivot Points are a modified variation of traditional pivot points created by Sylvain Vervoort (SVE). They are designed to adapt more dynamically to price volatility and short-term market structure, giving traders more responsive support and resistance levels.
Unlike standard floor pivots that rely only on the previous period’s high/low/close, SVE Pivot Points incorporate volatility-based smoothing, making the levels more stable during choppy markets and more reactive when volatility expands.
1. Volatility-Adaptive Formulas
SVE uses smoothing techniques (often EMA-based or Vervoort’s proprietary volatility filters) that adjust to current market noise.
This reduces false levels and gives clearer reaction zones.
2. Dynamic Support & Resistance
You still get:
• Pivot (P)
• Support levels (S1, S2, S3)
• Resistance levels (R1, R2, R3)
But they update based on volatility-weighted highs/lows instead of raw numbers.
3. More Reliable in Intraday Trading
SVE pivot points were designed to:
• Improve accuracy
• Reduce whipsaw
• Give better intraday turning points
This is why they’re popular among futures, forex, and index traders.
